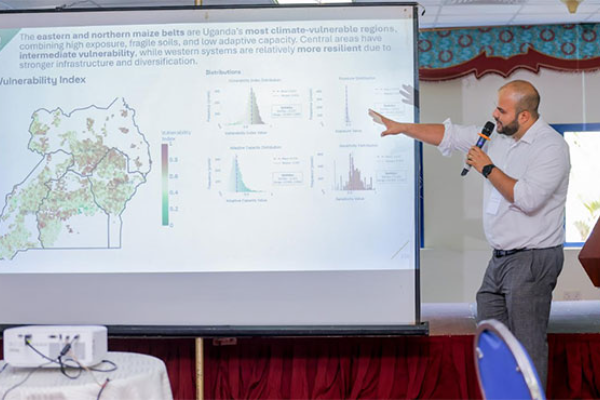
A new tool developed by Alliance for a Green Revolution in Africa (AGRA) in partnership with Mathematica Global is being rolled out in Uganda to help smallholder farmers, policymakers and investors pinpoint where agricultural systems are most at risk from climate shocks and guide action accordingly.
The climate-vulnerability map and dashboard tool draws together decades of climate, soil, socio-economic and farming-systems data to produce spatial “heat maps” of risk exposure, sensitivity and adaptive capacity across Uganda’s principal crop zones.
As the agriculture sector faces erratic rainfall, higher temperatures and land-degradation, the tool aims to make the invisible visible — showing where vulnerability is greatest, and where interventions can have maximum impact.
Mapping risk to staple crops
Agriculture remains a backbone of Uganda’s economy, with crops like maize, beans and cassava central to food security and rural incomes. The mapping exercise focuses on those crops and farming systems, analysing variables such as “consecutive dry days”, “maximum five-day rainfall”, soil conditions and farmers’ capacity to adapt.
According to Dr Paul Mwambu, Commissioner for Crop Inspection and Certification at the Ministry of Agriculture, Animal Industry and Fisheries (MAAIF), the tool is “a powerful, evidence-based compass that helps us allocate resources responsibly and identify practical interventions that protect yields, incomes and livelihoods.”
From data to decisions
The dashboard allows both macro- and micro-level users — from national policy planners to district extension agents and farmers themselves — to explore climate-risk scenarios up to the year 2050.
For example, in drought-prone regions such as Teso and Lango the maps recommend early planting, mulching and small-scale water harvesting; in wetter regions like Elgon highlands, bean farmers are advised to use raised beds and climbing varieties to avoid waterlogging.
David Wozemba, AGRA’s Country Director in Uganda, emphasises that the tool is not simply about charting risks but steering action: “Our role is to provide the right evidence of where those risks exist, and how actors … can build adaptive capacity to solve issues that are holding back agricultural transformation.”
Bridging science and small-farm realities
Beyond the technical modelling, the mapping tool was validated through a two-day workshop in Entebbe (October 22–23) where scientists, extension officers and farmers worked together to test the outputs against real-world conditions.
Farmer-leader Denis Kabito of the Uganda National Young Farmers Association described the maps as “a bridge between scientists and those who work the land … it gives us a chance to interact with technology and reality.”
The tool’s design follows the framework of the Intergovernmental Panel on Climate Change (IPCC): vulnerability equals exposure times sensitivity divided by adaptive capacity — and the result is an interactive visual that can show, for example, how a maize-belt area in central Uganda compares with a cassava zone in the north.
A timely opportunity for adaptation and investment
Uganda’s National Adaptation Plan for Agriculture and its Fourth National Development Plan emphasise climate-smart production and competitiveness of value chains.
The mapping tool is seen as a way to support these objectives by helping public and private actors target drought-tolerant seed varieties such as NARO Maize and NARO Bean, prioritise irrigation or storage investments and focus extension services where yield losses are highest.
At the policy level, the tool is expected to feed into seed distribution, crop insurance, financial services and infrastructure planning. “Without proper assessment, we don’t know what’s broken within the system,” Wozemba said. “Data has to be transformed into tools that decision-makers can use.”
Looking ahead
While the mapping project currently covers Uganda as part of a regional initiative (including Kenya, Tanzania, Ghana and Zambia) supported by the Bill & Melinda Gates Foundation, its success hinges on uptake — turning maps into movement.
As vulnerability hotspots become clearer, stakeholders hope that adaptation becomes less reactive and more anchored in planning, investment and coordination. If deployed properly, the tool could mark a shift from uncertainty to resilience in Uganda’s agriculture.
“If we don’t prepare now, these stresses will intensify. But if we act on this evidence, we can adapt and avert crisis,” said AGRA’s Dr Jeremiah Rugito.
For Uganda’s smallholder farmers — who face unpredictable weather, degraded soils and limited access to formal risk-management tools — the mapping initiative offers a chance to move from survival mode into strategic adaptation.
The next step will be integrating the dashboard into district plans, extension work and farmer-friendly applications to ensure that the data leads to tangible change on the ground.


